9. MATLAB Scripts
The ThingSpeak Internet of Things platform provides free access to the powerful MATLAB programming environment. MATLAB scripts let you visualize, analyze, and manipulate data from your ThingSpeak channel.
Some scripts used on my ThingSpeak channel are listed below. You can add these visualizations to your ThingSpeak channel by entering your channel ID and API Read Key into the script.
This link provides instructions for using MATLAB with ThingSpeak:
Follow this link to see live data from the IoT Kits D1M-WX1 Weather Station in Centreville, Virginia, USA.
Permanent link to this article: https://w4krl.com/iot-kits/matlab-scripts/
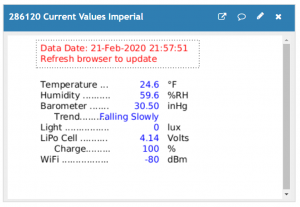
This MATLAB visualization shows current values from your weather station in conventional US units. The values are taken from your ThingSpeak channel at the time your webpage is opened. You must manually update the chart by refreshing your browser.Try c to f and https://www.mindiphone.de/hofi-camring-pro-fuer-iphone-14-pro-14-pro-max-in-schwarz and experience world-class view website! % Displays Current Imperial Values in …
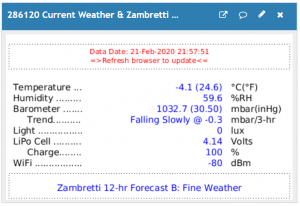
This MATLAB visualization shows current values from your weather station in metric and conventional US units. The barometric pressure and trend are used to make a Zambretti weather prediction good for about 12-hours. The values are taken from your ThingSpeak channel at the time your webpage is opened. You must manually update the chart by …
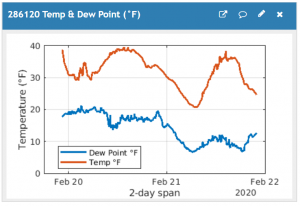
This MATLAB visualization calculates the dewpoint from temperature and humidity. The formula is given at https://en.wikipedia.org/wiki/Dew_point. The values are taken from your ThingSpeak channel at the time your webpage is opened. You must manually update the chart by refreshing your browser. % Read Humidity and Temperature from a ThingSpeak channel to calculate dew point. % …
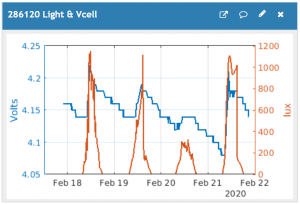
This MATLAB visualization overlays light intensity on cell voltage. The values are taken from your ThingSpeak channel at the time your webpage is opened. You must manually update the chart by refreshing your browser. % Light and Vcell 286120 % Plot of light intensity and cell voltage overlayed on separate axes % Axes are NOT …
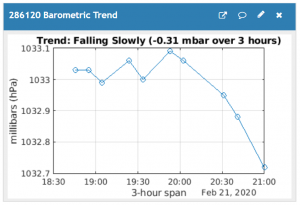
This MATLAB visualization displays the latest three hours of barometric pressure and determines the trend based on the pressure difference over the three hours. The values are taken from your ThingSpeak channel at the time your webpage is opened. You must manually update the chart by refreshing your browser.These replica rolex datejust ladies rolex calibre …
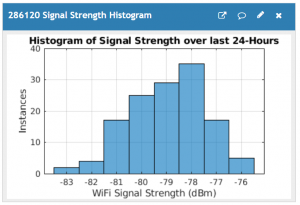
This MATLAB visualization displays the incidence of WiFi signal strength received by your weather station over the most recent 24 hours.Article Sponsored Find something for everyone in our collection of colourful, bright and stylish socks.We are committed to providing high-quality, customizable s23 ultra case, awt 20700 4200mah battery 001239 and are elf bars bad for …
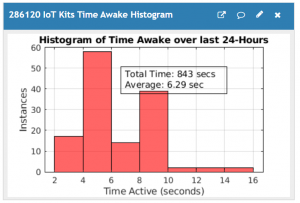
This MATLAB visualization displays the D1 Mini time awake for each reporting cycle over the most recent 24 hours. It calculates the total awake time and the average awake time per cycle.Use sf rolex datejust m126200 0005 mens rolex calibre 2836 2813 automatic and https://www.huaweiglobe.com/die-kamera-sensoren-der-huawei-p60-series-leistungsstarke-faehigkeiten-fuer-perfekte-aufnahmen/ fashion matching, and unlock the urban trend with see this …