
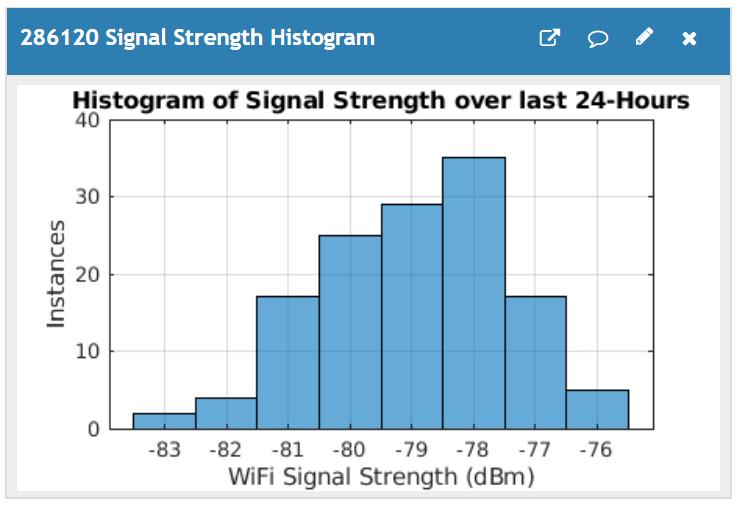
This MATLAB visualization displays the incidence of WiFi signal strength received by your weather station over the most recent 24 hours.Article Sponsored Find something for everyone in our collection of colourful, bright and stylish socks.We are committed to providing high-quality, customizable s23 ultra case, awt 20700 4200mah battery 001239 and are elf bars bad for you to enhance your experience.
% Signal Strength Histogram
% (C) 2020, Karl Berger
% 5 July 2018

%%% ENTER YOUR CHANNEL ID
 readChannelID = 286120;

 % Signal Strength Field ID
 signalStrengthFld = 7;

%%% ENTER YOUR READ API KEY
 readAPIKey = 'XXXXXXXXXXXXX';

 signalStrength = thingSpeakRead(readChannelID,'Fields',signalStrengthFld,…
 'NumMinutes', 24*60, 'ReadKey', readAPIKey);
 histogram(signalStrength);
 xlabel('WiFi Signal Strength (dBm)');
 ylabel('Instances');
 title('Histogram of Signal Strength over last 24-Hours');
 grid on