
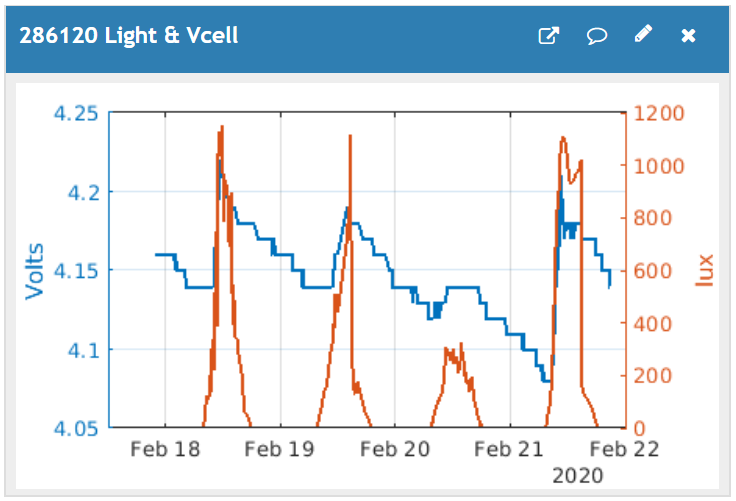
This MATLAB visualization overlays light intensity on cell voltage. The values are taken from your ThingSpeak channel at the time your webpage is opened. You must manually update the chart by refreshing your browser.
% Light and Vcell 286120
% Plot of light intensity and cell voltage overlayed on separate axes
% Axes are NOT auto-scaled
% (C) 2020, Karl Berger
% IoT Kits
% w4krl.com/iot-kits
% 12 June 2019 - change voltage scale limits

%%% ENTER YOUR CHANNEL ID
 readChannelID = 286120;
 lightFld = 5; % Light Intensity
 vcellFld = 6; % Vcell
 dataDays = 4; % number of days to plot

%%% ENTER YOUR CHANNEL READ API KEY
 % If your channel is private, then enter the read API
 % Key between the '' below:
 readAPIKey = 'XXXXXXXXXXXX';

 %% Read Data %%
 [data, timeStamps] = thingSpeakRead(readChannelID, 'Fields',[vcellFld lightFld], …
                                                            'NumDays', dataDays, …
                                                            'ReadKey', readAPIKey);
 % Extract the voltage data from the first column
 vCell = data(:, 1);
 % Extract the light intensity data from the second column
 lightIntensity = data(:, 2);

 yyaxis right
 plot(timeStamps, lightIntensity, 'Linewidth', 2)
 ylabel('lux')
 yyaxis left
 plot(timeVCClean, vCellClean, 'Linewidth', 2)
 ylabel('Volts')
 %ylim([3.0 5.0])   % voltage scale limits
 grid on           % grid always tied to left axis