
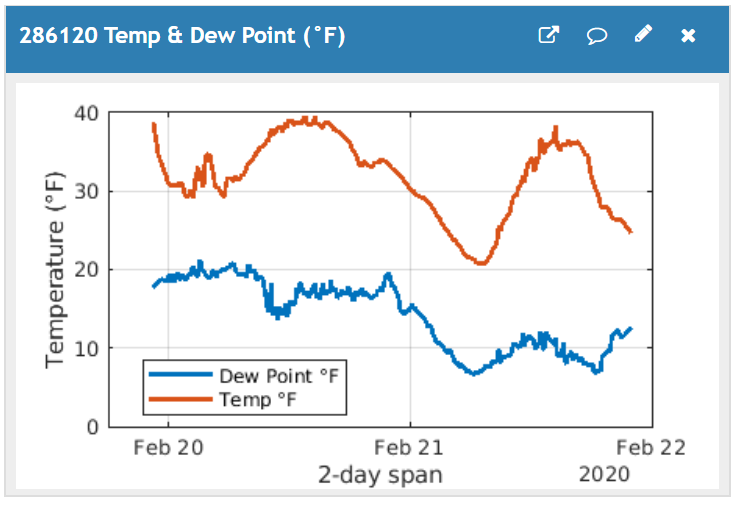
This MATLAB visualization calculates the dewpoint from temperature and humidity. The formula is given at https://en.wikipedia.org/wiki/Dew_point. The values are taken from your ThingSpeak channel at the time your webpage is opened. You must manually update the chart by refreshing your browser.
% Read Humidity and Temperature from a ThingSpeak channel to calculate dew point.
 % (C) 2020 Karl Berger
 % 21 November 2018 - changed to Matlab plot
 % 30 October 2019 - changed to Numminutes in thingSpeakRead
 % Script expects temperature in °C. It then calculates dewpoint in °C.
 % Calculated temperatures are converted to °F for charting.
 % If you read temperature in °F, you must first convert it to °C
 % before doing the dewpoint calculation.
 %%% ENTER YOUR CHANNEL ID
  chID = 286120;
 %% IoT Kits field definitions
   TempCFld = 1;  % Temperature Field ID
   HumidFld = 2;  % Humidity Field ID
 % Number of data points to plot
  dataMinutes = 2 * 24 * 60;    % days * 24 hours * 60 minutes/hour
  % Read field data and time for Temperature sensor
  [tempC, time] = thingSpeakRead(chID, 'Fields', TempCFld, 'NumMinutes', dataMinutes);
  % Read field data for Humidity sensor
  humidity = thingSpeakRead(chID, 'Fields', HumidFld, 'NumMinutes', dataMinutes);
  % Calculate dew point
  % Specify the constants for water vapor (b) and barometric (c) pressure.
  % NOAA constants https://en.wikipedia.org/wiki/Dew_point
  b = 17.67;
  c = 243.5;
  % Calculate the intermediate value 'gamma'
  gamma = log(humidity / 100) + b * tempC ./ (c + tempC);
  % Calculate dew point in Celsius
  dewPointC = c * gamma ./ (b - gamma);
  % Convert temperatures to Fahrenheit for display
  dewPointF = (dewPointC * 1.8) + 32;
  tempF = (tempC * 1.8) + 32;
  plot(time, [dewPointF, tempF], 'Linewidth', 2)
  ylabel('Temperature (°F)')
  xlabel('2-day span')
  legend('Dew Point °F', 'Temp °F', 'Location', 'Best')
  grid on